
In this tutorial we'll setup an ELK stack using the following components:
- Kibana (oss)
- Elasticsearch (oss)
- Filebeat (oss)
We will explain the steps and then ask you to write your compose and configuration files. You should be able to follow along nicely.
Installing & Configuring Kibana
First you'll have to choose a version of kibana. You can find a list with tags for the kibana namespace here: https://www.docker.elastic.co/r/kibana
We'll continue with the oss version. This only contains features available under the Apache 2.0 license.
You could meanwhile pull the image explicitly. This way you can keep on reading and use the time while it downloads the ~300MB image.
$ docker pull docker.elastic.co/kibana/kibana-oss:7.8.0
Configure kibana
Generally kibana is configured using the $KIBANA_HOME/config/kibana.yml file. You would create your own, and the mount it as shown below:
services:
  kibana:
image: docker.elastic.co/kibana/kibana-oss:7.8.0
    volumes:
      - ./conf/kibana.yml:/usr/share/kibana/config/kibana.yml
An example file could look like:
server.name: kibana
elasticsearch.url: "http://elasticsearch:9200"
You can find a list of possible values in the kibana.yml on github. Note that docker instances of kibana use different default values (explained further below)
Another manner for configuring a docker instance is by means of environment variables. Have a look at the example below:
services:
  kibana:
image: docker.elastic.co/kibana/kibana-oss:7.8.0
    environment:
      SERVER_NAME: kibana
      ELASTICSEARCH_HOSTS: "http://elasticsearch:9200"
These are mapped to command line arguments. The translation between environment variables and kibana settings is: environment variables are in uppercase, and they use underscores instead of dots as a separator. (See the source for this translation here: kibana-docker)
However, we won't need much configuration. This is because docker has already set sensible default values for (see docker's kibana.yml)
| setting | default |
|---|---|
| server.name | kibana |
| server.host | 0 |
| elasticsearch.hosts | http://elasticsearch:9200 |
In addition, docker sets the cpu.cgroup.path.override and cpuacct.cgroup.path.override
Please note the default name for the elasticsearch hosts. We will define our Elasticsearch shortly inside the same docker-compose file. We'll name the service elasticsearch. It will then be available on the compose network with that domain name. (The default port of Elasticsearch is 9200)
Exposing kibana
We want to make kibana available from outside of docker. You have a few options:
- Just publish the port using
-p. - Use a reverse proxy (e.g, Traefik)
- Use a VPN
Kibana does not have any form of authorisation. This means you should only use the first option when everyone with access to the machine running kibana may use kibana. In addition, you would have to configure kibana to use TLS (see the docs: configuring -tls.html). For this tutorial we'll however use this option (we'll set it up shortly)
For production, it is probably easiest to use a reverse proxy. This way you can use your proxy for TLS termination and use authentication (or an IP Allow list).
Here's an example that uses basic authentication and allows encryption for TLS (remember we won't be using this in this tutorial, just FYI)
services:
  traefik:
image: "traefik:v2.2"
    command:
      - "--providers.docker=true"
      - "--entrypoints.web.address=:80"
      - "--entryPoints.websecure.address=:443"
      - "--certificatesResolvers.le.acme.email=…"
      - "--certificatesresolvers.le.acme.storage=/letsencrypt/acme.json"
      - "--certificatesresolvers.le.acme.tlschallenge=true"
    ports:
      - "80:80"
      - "443:443"
    volumes:
      - "/var/run/docker.sock:/var/run/docker.sock:ro"
      - "./letsencrypt:/letsencrypt"
  kibana:
image: docker.elastic.co/kibana/kibana-oss:7.6.2
    labels:
          - "traefik.http.routers.kibana.rule=Host(`kibana.myhost.com`)"
          - "traefik.http.services.kibana.loadbalancer.server.port=5601"
          - "traefik.http.routers.kibana.tls=true"
          - "traefik.http.routers.kibana.tls.certresolver=le"
          - "traefik.http.routers.kibana.entrypoints=websecure"
          - "traefik.http.middlewares.kibana-auth.basicauth.users=${KIBANA_AUTH}"
          - "traefik.http.middlewares.kibana-auth.basicauth.realm=kibana"
          - "traefik.http.routers.kibana.middlewares=kibana-auth"
For the username/password we could use an environment variable KIBANA_AUTH. You could place this inside a .env file inside the docker compose directory, like this:
KIBANA_AUTH=admin:$apr1$tz/fB.Re$tyxy4T4rd1B./JP3IQ2Qv/
The hashed password could be generated using htpasswd:
$ admin:$apr1$tz/fB.Re$tyxy4T4rd1B./JP3IQ2Qv/
If you would not use a .env file and would instead want to place the digest value inside the compose file, you would have to escape the dollar signs:
$ htpasswd -nb admin secret123 | sed -e s/\\$/\\$\\$/g
However, for this tutorial we'll use a simple port mapping. Inside a new directory, create a file named docker-compose.yaml and add the following contents:
version: "3.7"
services:
  kibana:
image: docker.elastic.co/kibana/kibana-oss:7.6.2
    restart: always
    ports:
      - 5601:5601
If you wanted to use a VPN, you would bind to that ip address (e.g, 192.168.2.1:5601). In a previous tutorial we explored setting up a WireGuard VPN docker/WireGuard part 1 and how to use it together with docker: docker/WireGuard part 2.
Installing elasticsearch
Just as with kibana, we'll be using the oss version (check this page for available tags https://www.docker.elastic.co/r/elasticsearch)
Let's again pull in while you continue reading:
$ docker pull docker.elastic.co/elasticsearch/elasticsearch-oss:7.8.0
Configuring elasticsearch
The configuration file for elasticsearch is read from /usr/share/elasticsearch/config/elasticsearch.yml.
The defaults are as follows:
cluster.name: "docker-cluster"
network.host: 0.0.0.0
As illustrated when we went through the installation of kibana, you could either mount your configuration file or use environment variables. Environment variables have the same names as configuration items (iow not uppercase and no underscores)
When using environment variables we've got two options. We can either provide literal values (e.g, ELASTIC_PASSWORD=) or suffix the variable with _FILE (e.g , ELASTIC_PASSWORD_FILE=myfile). When using the latter, the contents of the file is used as the value.
In production, you would have multiple elasticsearch instances running in a cluster. You might have to set up authentication and TLS between the cluster members. You would have to set the node.name, a way to discover node members (e.g, discovery.seed_hosts) and which nodes will be candidates for cluster leaders (e.g, cluster.initial_master_nodes).
For this tutorial we'll use a single node cluster. In order for this to work, we'll have to set the discovery to "single-node" (this way it will become itself the leader and will not attempt to join other nodes in its cluster). Later when we get to writing the compose definition, we'll use the setting: discovery.ype=single-node.
Configure Java
There's however more configuration to be done. Inside the /usr/share/elasticsearch/config there's also a jvm.options file to configure the Java Virtual Machine. See the default version of this file here: jvm.options
As before you could mount your own jvm.options file. It is not likely you'll need to change the JVM options, except for the heap size (the "working-memory" of a Java Application). The default heap size is: 1 GB.
If you wanted to override some of the JVM settings you can use the ES_JAVA_OPTS environment variable. For example to change the heap size to 4 GB you would set the initial (-Xms) amd max size (-Xmx) to 4g.
services:
  elasticsearch:
image: docker.elastic.co/elasticsearch/elasticsearch-oss:7.8.0
    environment:
      ES_JAVA_OPTS: "-Xms4g -Xmx4g"
However, we'll keep the defaults.
Volumes
Elasticsearch stores its data in /usr/share/elasticsearch/data and you must bind this not to lose your data. It is advised you use a docker or kubernetes volume with fast I/O.
For our tutorial, we'll use a simple volume mapping in our compose file.
This is the last piece of the puzzle, se we are ready to define the elasticsearch service and the volume. You already defined the kibana parts.
version: "3.7"
services:
 kibana:
image: docker.elastic.co/kibana/kibana-oss:7.6.2
   ports:
     - 5601:5601
 elasticsearch:
image: docker.elastic.co/elasticsearch/elasticsearch-oss:7.8.0
   environment:
     discovery.type: "single-node"
   volumes:
     - esdata:/usr/share/elasticsearch/data
volumes:
 esdata:
Then bring up the project:
$ docker-compose up -d
You should be able to access http://localhost:5601 However, don't click anywhere yet
We'll have some more configuration to do.
Elasticsearch Production notes
We won't go through all the settings needed for production. A few important ones are shown below:
-
You would need to set the
vm.max_map_countkernel setting to262144or higher:$ sudo sysctl -w vm.max_map_count=262144 -
increase the
ulimitsof your containers:services: elasticsearch: image: docker.elastic.co/elasticsearch/elasticsearch-oss:7.8.0 ulimits: memlock: soft: -1 hard: -1 nofile: soft: 65536 hard: 65536
See docker.html#docker-prod-prerequisites for more information.
Beats
Bears, Beets, Battlestar (Jim Halpert)
Well in this case "Beats". Beats are agents that reap data and send it to elasticsearch. You can also place Logstash between beats and elasticsearch for ETL. We won't be adding that during this tutorial.
Meet some of the beats family members:
- Filebeat: logs and other data
- Metricbeat: for metric data
- Packetbeat: for network data
- Heartbeat: uptime monitoring
For a full list see https://www.elastic.co/beats/
In this tutorial we'll be setting up Filebeat.
Beats can be installed as agents on your nodes. We'll be using the docker installation for this tutorial.
You may download the image while you read on:
$ docker pull docker.elastic.co/beats/filebeat-oss:7.8.0
As you noticed, we are again using the oss version. See https://www.docker.elastic.co/r/beats for an overview of available tags and versions.
Configure Filebeat
Filebeat is configured through the /usr/share/filebeat/filebeat.yml configuration file. We'll be using the defaults as provided on github. This configuration uses "Hint based auto-discover". We'll explain it further below.
Create a subdirectory conf and download the configuration to it:
$ mkdir conf && \
  curl -o conf/filebeat.docker.yml https://raw.githubusercontent.com/elastic/beats/7.8/deploy/docker/filebeat.docker.yml
If you open the file, you'll find the following configuration:
filebeat.config:
  modules:
    path: ${path.config}/modules.d/*.yml
    reload.enabled: false

filebeat.autodiscover:
  providers:
    - type: docker
      hints.enabled: true

processors:
- add_cloud_metadata: ~

output.elasticsearch:
  hosts: '${ELASTICSEARCH_HOSTS:elasticsearch:9200}'
  username: '${ELASTICSEARCH_USERNAME:}'
  password: '${ELASTICSEARCH_PASSWORD:}'
Let's walk through this configuration:
- It starts by enabling all modules that are available in filebeat's
modules.ddirectory (this includes modules such asnginx,kafka,redisand others). Modules are aware of the log format of specific products. - It then enables auto-discover. In particular for the docker provider (other providers include kubernetes and jolokia).
- The docker-provider will use hint-based configuration (as apposed defining it in this file). More on this further below.
- Processors filter/enhance the data. In this case we add cloud metadata (for AWS, GCO, Azure etc). We'll replace this below.
- It then sets the destination ot the reaped data. This corresponds to our elasticsearch instance.configuration
Let's change the processors to only add docker metadata (container id, name, image and labels)
processors:
- add_docker_metadata: ~
(If you're wondering what the purpose of the tilde (~ ) is, it is yaml's null value (we use the processor, but we won't configure it further)
Config File permissions
From the documentation:
"On systems with POSIX file permissions, all Beats configuration files are subject to ownership and file permission checks The purpose of these checks is to prevent unauthorized users from providing or modifying configurations that are run by the Beat. The owner of the configuration file must be either root or the user who is executing the Beat process. The permissions on the file must disallow writes by anyone other than the owner."
So we must change the ownership of our config file
$ sudo chown root conf/filebeat.docker.yml
and revoke all write permissions, but that of the owner:
$ sudo chmod go-w conf/filebeat.docker.yml
Install Filebeat
To add filebeat to our compose file, we'll have to add the following volume mounts:
- binding our configuration to
/usr/share/filebeat/filebeat.yml - binding the location of docker container directory
/var/lib/docker/containersto the container - binding our docker socket
/var/run/docker.sockto the container
In order for the container to access these resources, it must use the root user.
Add the following service to your compose file:
filebeat:
image: docker.elastic.co/beats/filebeat-oss:7.8.0
  user: root
  volumes:
    - ./conf/filebeat.docker.yml:/usr/share/filebeat/filebeat.yml
    - /var/lib/docker/containers:/var/lib/docker/containers:ro
    - /var/run/docker.sock:/var/run/docker.sock:ro
And start it:
$ docker-compose up -d
A First Application Service
We'll add a simple application that logs messages explicitly. It is available on docker hub: https://hub.docker.com/r/edc4it/logger
Add the following service to your compose file:
app1:
image: edc4it/logger:1.0
And start our new application:
$ docker-compose up -d
Visualise data in Kibana
Open your kibana instance in your browser (http://localhost:5601)
You should see the following welcome message:

Click on Explore on my own and you'll be presented with the home screen. On the right you will find the option to obtain data from your elasticsearch instance:

After clicking that, you are able to define a filter
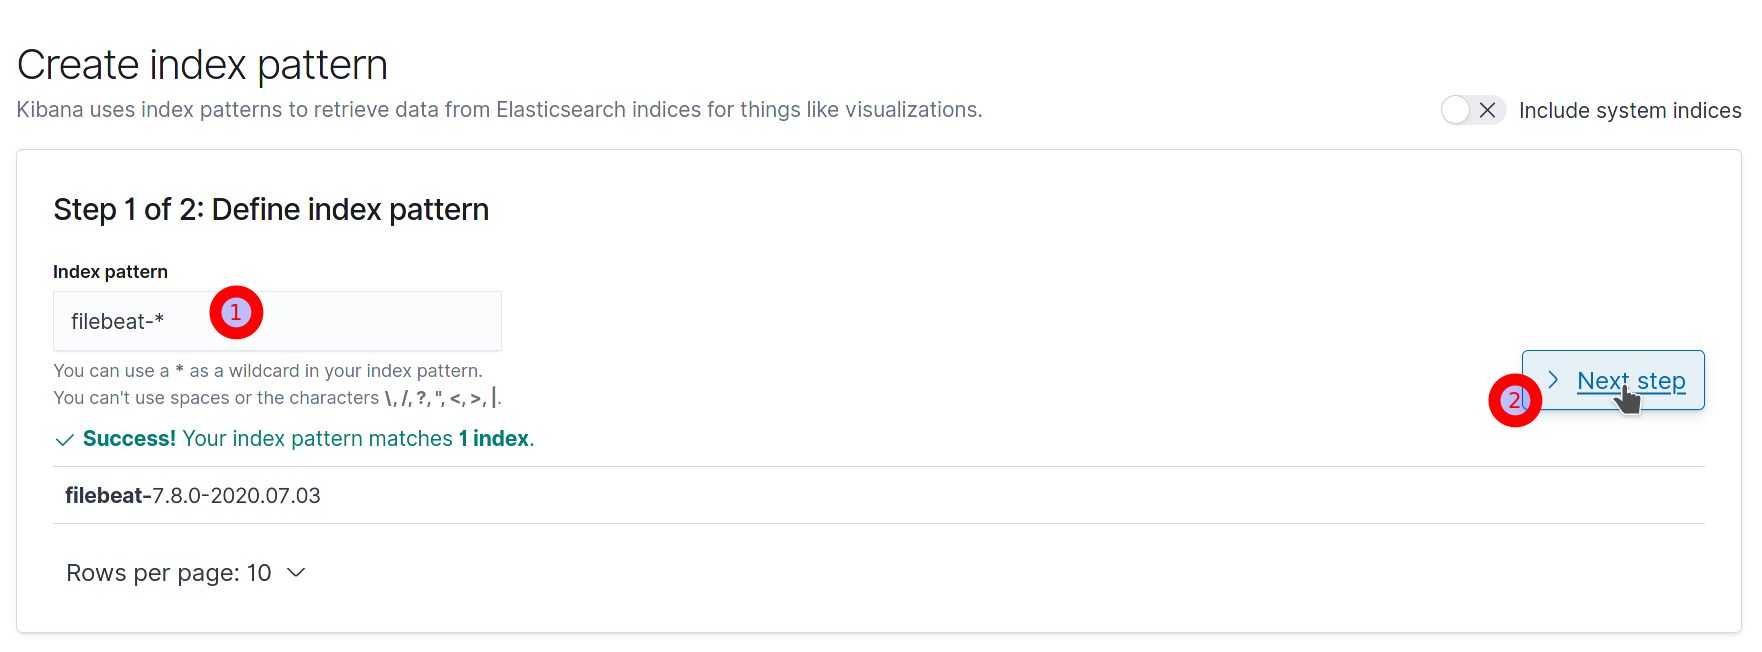
First define a search pattern (filebeat-*) and then click Next step
On the next step you need to indicate which fields hold the timestamp value. Choose @timestamp:
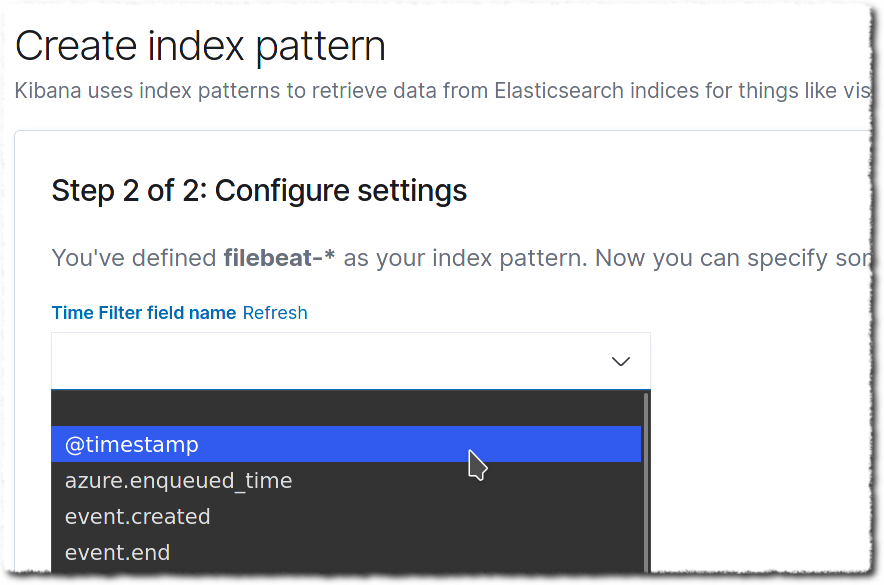
Discover view
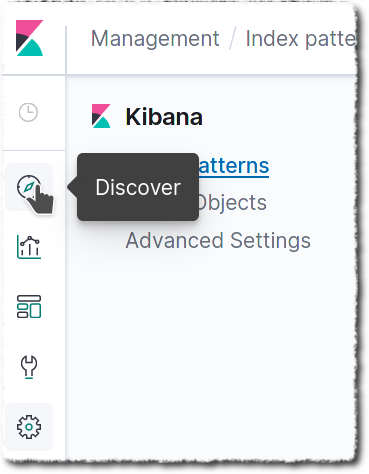
Let's try and find some log messages from our test container. In the sidebar menu, select Discover
You should see a list of entries. Let's filter it so we only see messages from our container. In a production environment you would probably have used labels and would filter on those. We did not add labels to our container. We'll filter in the image name instead:
Click on Add filter and then use the dialog to filter on containers from our test image.
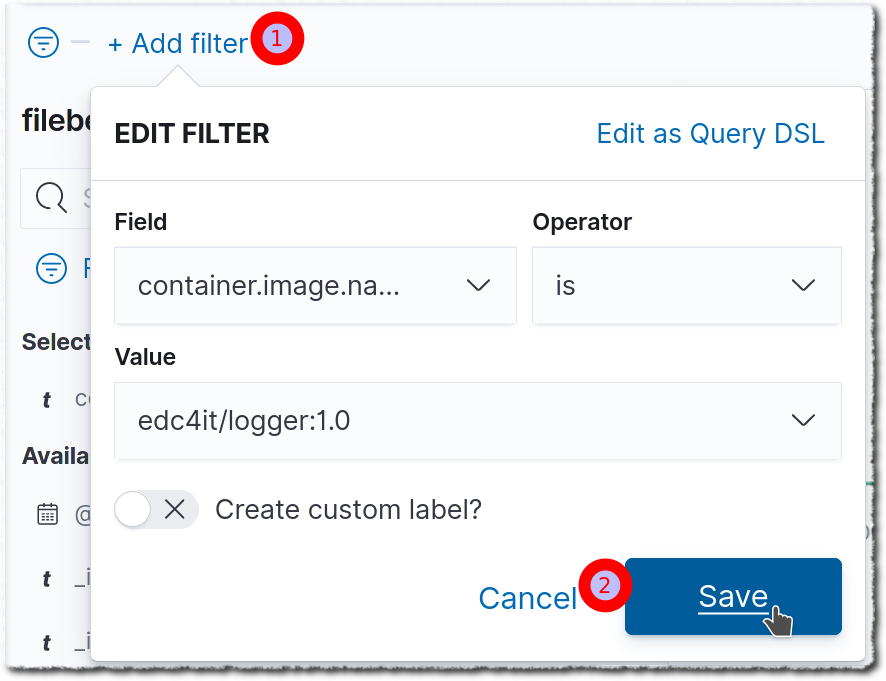
You should be able to find the messages in the table (make sure the time range includes the time you launched the application. You might as well set it to "Today")
Use a module
As a final step, let's add another application service. This time we'll use an nginx instance. Filebeat has a module that understands the format of nginx log message (similarly, it has an apache module)
We'll need to tell filebeat to use this module. This is fairly simple, because we are using "hint-based" autodiscover.
To use hint based configuration, you add special labels to your container. In our case we need to set co.elastic.logs/module=nginx
Add the following service to your compose file:
site:
image: nginx
  ports:
    - 8080:80
  labels:
    - "co.elastic.logs/module=nginx"
Then visit your new site a few times on http://localhost:8808
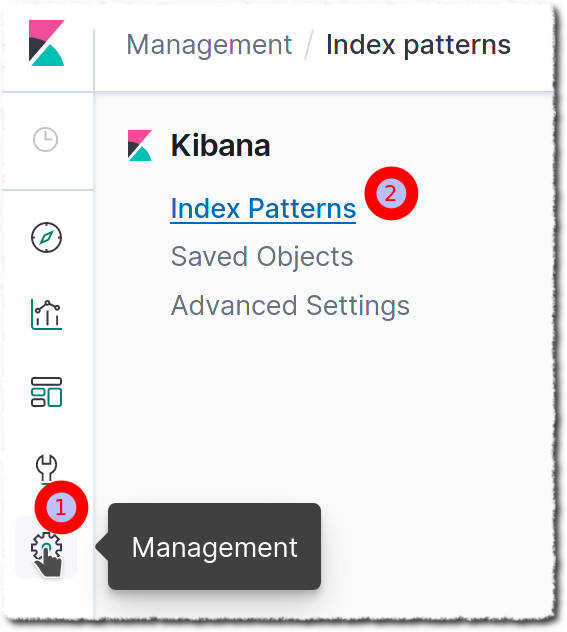
Before you can see your data, you need to refresh the fields. Choose settings from the menu and follow Index Patterns as illustrated in the image below:
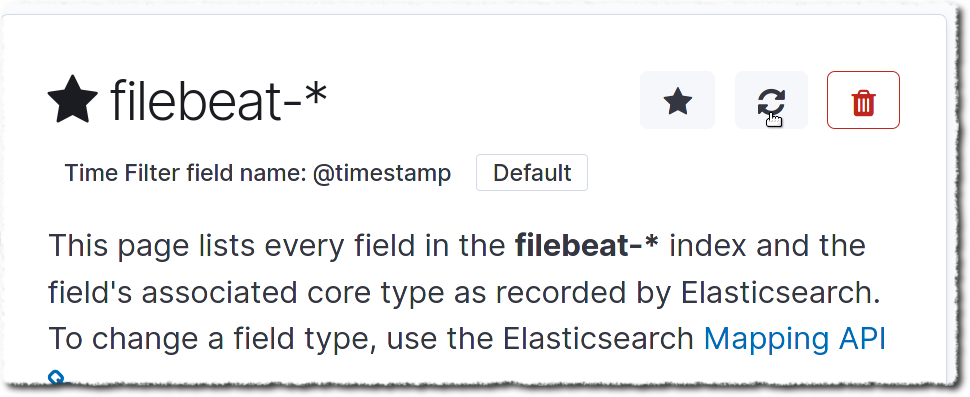
Then click on our index filebeat-* and refresh the fields:
When you now go back to the Discover page, you should be able to see your log messages.